
在项目中uniapp 中对接echarts 后app 打包后不兼容,我们可以用renderjs 来解决,因为打包成app 就没了V8引擎 echarts中组件无法使用document 等相关浏览器属性。所以uniapp 官网使用了renderjs 视图层的渲染js 框架。
代码如下:
<template>
<view class='container'>
<div ref="chartCanvas" id='chartCanvas' :chartDataParams="chartData"
:change:chartDataParams="renderscript.updateData" style="height:100%; width: 100%;flex:1;"></div>
</view>
</template>
<script>
const lineChartData = {
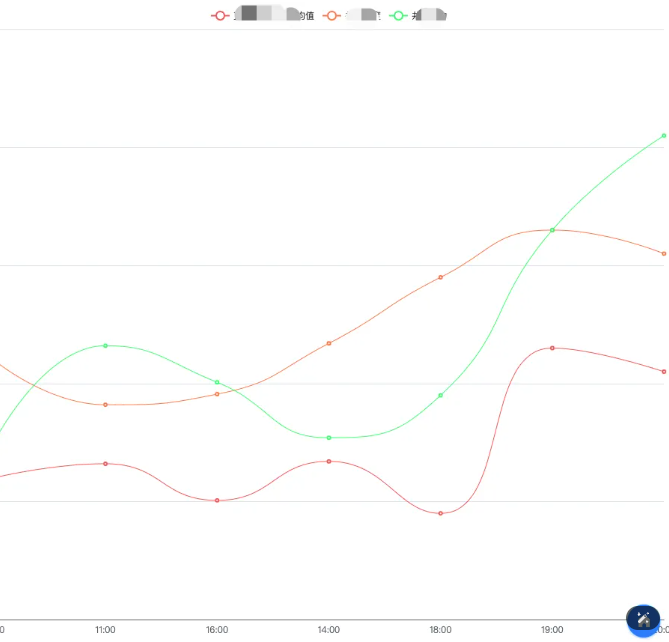
legends: ['直流母线电流平均值', '井下温度', '井下压力'],
colors: ['#EE6666', '#F98558', '#58F97B'],
xData: [
"12:00",
"11:00",
"16:00",
"14:00",
"18:00",
"19:00",
"20:00"
],
seriesDatas: [
[120, 132, 101, 134, 90, 230, 210],
[220, 182, 191, 234, 290, 330, 310],
[150, 232, 201, 154, 190, 330, 410]
],
}
export default {
data() {
return {
chartInstance: null,
chartData: {},
}
},
mounted() {
},
onReady() {
this.chartData = lineChartData;
},
onLoad(option) {
// #ifdef APP-PLUS
setTimeout(function() {
plus.screen.lockOrientation('landscape-primary');
}, 10)
//#endif
console.log(this.deviceList, '===')
},
//页面卸载时切换为竖屏配置
onUnload() {
// #ifdef APP-PLUS
plus.screen.lockOrientation('portrait-primary'); //锁死屏幕方向为竖屏
// #endif
},
// 监听页面返回
onBackPress(e) {
},
methods: {
},
beforeDestroy() {
}
}
</script>
<script module='renderscript' lang="renderjs">
import * as echarts from 'echarts';
import {
debounce
} from "@/utils/common.js";
export default {
data() {
return {
chartInstance: null,
chartData: {},
$_resizeHandler: null
};
},
watch: {
chartData: {
deep: true,
handler(val) {
this.setOptions(val)
}
}
},
//挂在后执行
mounted() {
console.log('randerjs: mounted')
this.initChart();
this.initListener()
},
//组件被激活调用
activated() {
if (!this.$_resizeHandler) {
// avoid duplication init
this.initListener()
}
// when keep-alive chart activated, auto resize
this.resize()
console.log("组件被激活");
},
methods: {
initListener() {
//节流函数
this.$_resizeHandler = debounce(() => {
this.resize()
}, 100)
window.addEventListener('resize', this.$_resizeHandler)
},
destroyListener() {
window.removeEventListener('resize', this.$_resizeHandler)
this.$_resizeHandler = null
},
resize() {
console.log("组件resize");
this.chartInstance && this.chartInstance.resize()
},
createSeriesData(series, color, legend) {
let seriesData = {
name: legend,
smooth: true,
type: 'line',
//点样式
itemStyle: {
color: color,
},
//线的样式
lineStyle: {
color: color,
width: 1
},
data: series,
animationDuration: 2800,
animationEasing: 'quadraticOut'
}
return seriesData
},
async initChart() {
// 等待 canvas 元素渲染完成(对于 H5 环境可能需要)
await this.$nextTick();
let systemInfo = uni.getSystemInfoSync()
let vHeight = systemInfo.windowHeight
let vWidth = systemInfo.windowWidth
console.log("vHeight:", vHeight);
console.log("vWidth:", vWidth);
// 获取 canvas 元素
this.chartInstance = echarts.init(document.getElementById('chartCanvas')); //this.$refs.chartCanvas);
this.setOptions(this.chartData)
},
setOptions({
legends,
colors,
xData,
seriesDatas
} = {}) {
if (!this.chartInstance) return;
let series = []
seriesDatas.forEach((item, index) => {
series.push(this.createSeriesData(item, colors[index], legends[index]))
})
this.chartInstance.setOption({
xAxis: {
data: xData,
boundaryGap: false,
axisTick: {
show: false
}
},
grid: {
left: 10,
right: 10,
bottom: 20,
top: 30,
containLabel: true
},
tooltip: {
trigger: 'axis',
axisPointer: {
type: 'cross'
},
padding: [5, 10]
},
yAxis: {
axisTick: {
show: false
},
show: true,
axisLabel: {
show: false, //y轴坐标刻度
},
splitArea: {
show: false //每个分割线的背景
}
},
legend: {
data: legends
},
series: series
})
},
updateData(newValue, oldValue, ownerInstance, instance) {
this.chartData = newValue;
console.log('randerjs: updateData')
},
},
onUnload() {
console.log('randerjs: unload')
},
beforeDestroy() {
console.log("销毁");
// 销毁图表实例以避免内存泄漏
if (this.chartInstance) {
this.chartInstance.dispose();
this.chartInstance = null;
}
this.destroyListener()
}
}
</script>:chartDataParams=”chartData” chartData 是传递到renderjs中的变量 这里可以直接在renderjs中调用接口,测试使用,
chartDataParams是定义的一个变更变量,可以任意取 只要 :chartDataParams 和:change:chartDataParams 匹配即可
:change:chartDataParams=”renderscript.updateData” ,当chartData的值发生变化,就调用updateData这个函数。
renderscript 是renderjs的模型名称 可以任意取名字
updateData(newValue, oldValue, ownerInstance, instance) {
this.chartData = newValue;
console.log('randerjs: updateData')
}
ownerInstance 是一个对象实例可以用来调用vue 的函数进行通信。
ownerInstance.callMethod(“函数名称”,参数)
效果如下:
